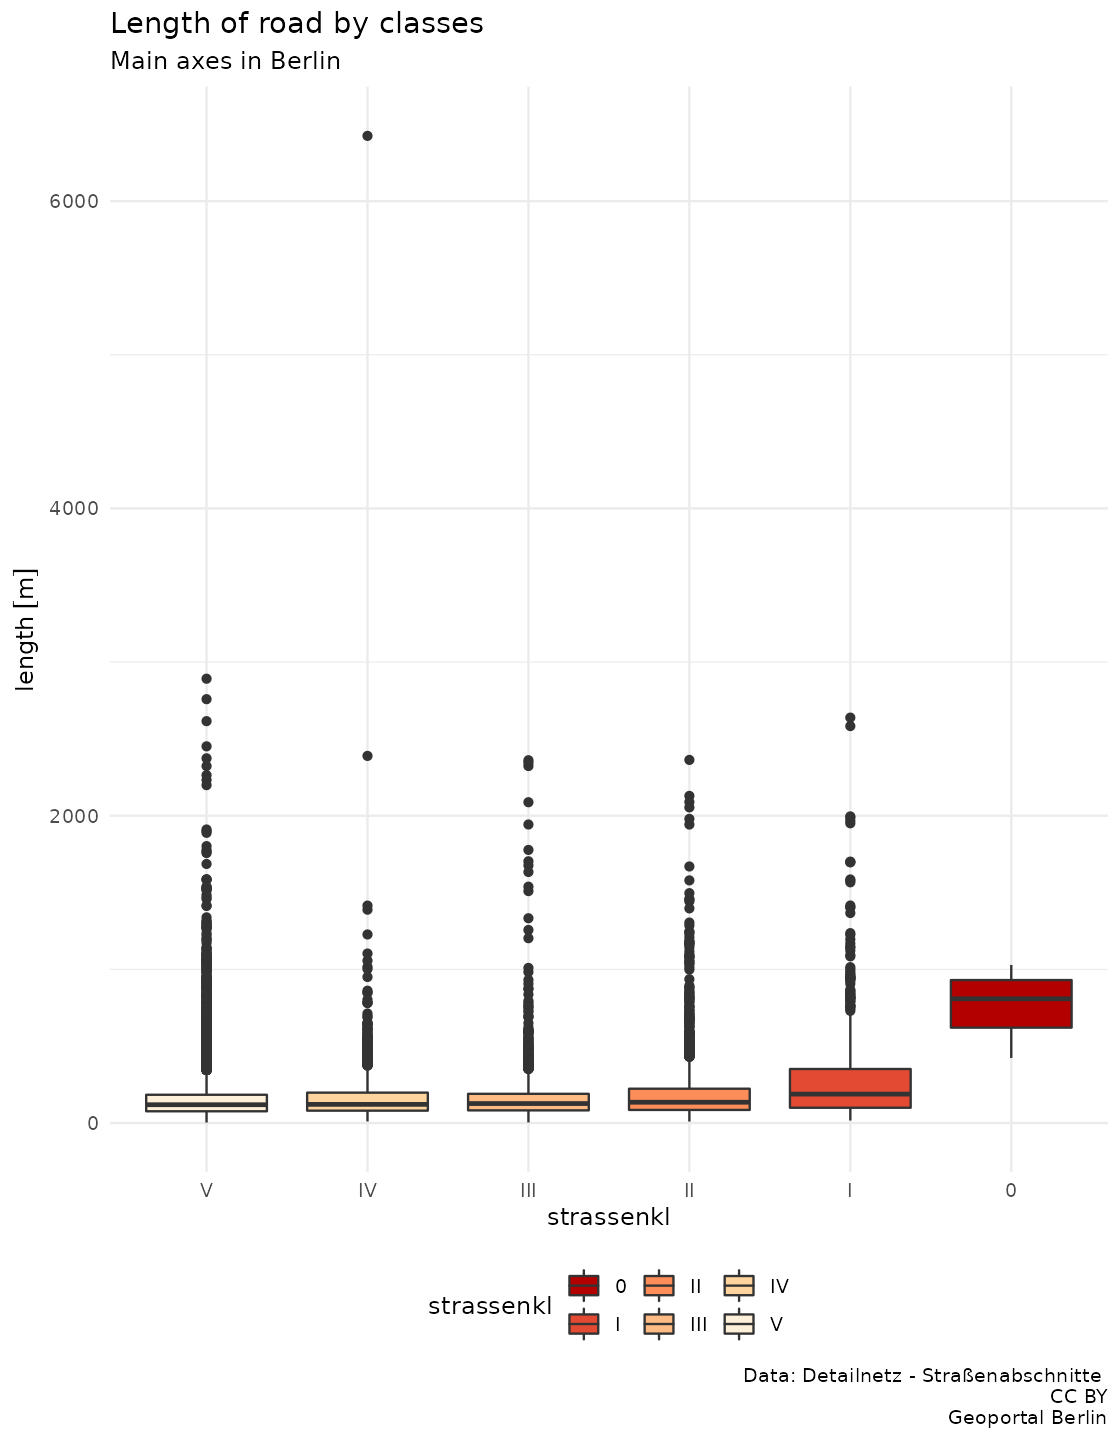
Yesterday we took a look at the length of each network by class. Today, let us see the variation of the length of roads by class
Exhibit of the day
A box plot of the length of road according to the class
Show the code of the exhibit
library (sf)library (dplyr)library (ggplot2)library (units)# "https://fbinter.stadt-berlin.de/fb/wfs/data/senstadt/s_vms_detailnetz_spatial_gesamt" # https://tsb-opendata.s3.eu-central-1.amazonaws.com/detailnetz_strassenabschnitte/Detailnetz-Strassenabschnitte.gml <- read_sf ("raw_data/Detailnetz-Strassenabschnitte.shp" )$ strassenkl <- factor (dsn$ strassenkl)$ strassenkl <- factor (dsn$ strassenkl,rev (levels (dsn$ strassenkl)))$ length <- st_length (dsn)<- dsn %>% as.data.frame %>% group_by (strassenkl) %>% summarise (length = sum (length)) %>% mutate (length = set_units (length,km))%>% # filter(length < set_units(5000, m)) %>% ggplot () + geom_boxplot (aes (x = length, y = strassenkl, fill= strassenkl)) + scale_fill_brewer (palette= "OrRd" ,limits = rev (levels (dsn$ strassenkl)),direction = - 1 ) + theme_minimal () + coord_flip () + theme (legend.position= "bottom" ) + labs (colour = "Road class" ) + labs (title = "Length of road by classes" ,subtitle = "Main axes in Berlin" ,caption = "Data: Detailnetz - Straßenabschnitte \n CC BY Geoportal Berlin" ) ggsave ("2022-03-17_roadlength_by_class.jpg" ,width= 7.0 ,height= 9 ,bg= "white" ,dpi = 160 )