Yesterday’s post was about bike accidents in general. I was curious to see if the time of the year plays a role in the spatial repartition.
Exhibit of the day
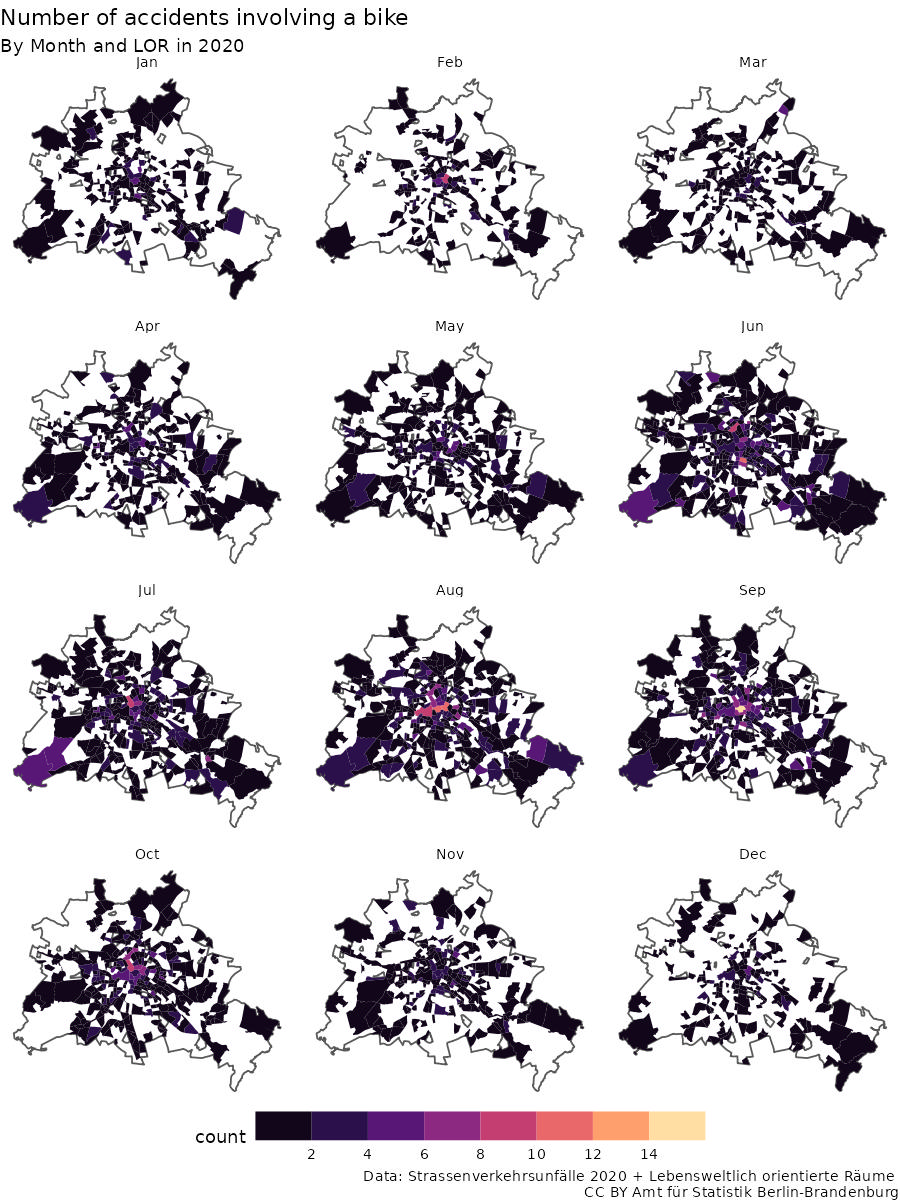
There is a correlation of intensity of traffic accidents with the summer as there are more bikers and then more traffic accidents (see this note). However it seems that there is no shift or huge change in the place where traffic accidents involving a bike happen.
Show the code of the exhibit
library(sf)library(dplyr)library(ggplot2)crash <-read.csv2("raw_data/AfSBBB_BE_LOR_Strasse_Strassenverkehrsunfaelle_2020_Datensatz.csv",colClasses =c(rep("character", 3),rep("factor", 9),rep("integer", 6),rep("factor", 1),rep("numeric", 4)))colnames(crash) |>tolower() ->colnames(crash)crash[13:18] <-sapply(crash[13:18] , as.logical)crash$umonat <-factor(crash$umonat, levels =1:12)levels(crash$umonat) <-format(seq.Date(as.Date('2000-01-01'), by ='month', len =12), "%b")crash <-subset(crash, istrad ==TRUE)crash |>group_by(lor_ab_2021, bez, umonat) |>summarise(count =n()) -> crash_loredlor <-st_read("raw_data/lor_planungsraeume_2021.gml")colnames(lor)[1:6] |>tolower() ->colnames(lor)[1:6]lor$plr_id <- lor$plr_id |>as.factor()subset(lor, select=-bez) -> lorlor_outer <-st_as_sf(st_union(crash_sf))crash_sf <-full_join(lor, crash_lored, by=c(plr_id ="lor_ab_2021"))crash_sf <- crash_sf[!is.na(crash_sf$umonat), ]ggplot(crash_sf ) +geom_sf(data=lor_outer, fill="white") +geom_sf(aes(fill = count), colour ="transparent",show.legend =TRUE) +scale_fill_viridis_b(option ="A", n.breaks =10) +facet_wrap(vars(umonat), ncol =3) +theme_void() +theme(legend.key.width =unit(0.1, "npc"),legend.position="bottom") +labs(title ="Number of accidents involving a bike",subtitle ="By Month and LOR in 2020",caption ="Data: Strassenverkehrsunfälle 2020 + Lebensweltlich orientierte Räume \nCC BY Amt für Statistik Berlin-Brandenburg")ggsave("2022-03-10_bike_crash_month_lor.jpg", width=7.5,height=10, bg="white", dpi =120)
Berlin’s map of bike accident by LOR. Data: Strassenverkehrsunfälle nach Unfallort in Berlin 2020 + Lebensweltlich orientierte Räume − CC BY Amt für Statistik Berlin-Brandenburg